
Plant Metrics (Part I)
Measuring What Matters Most
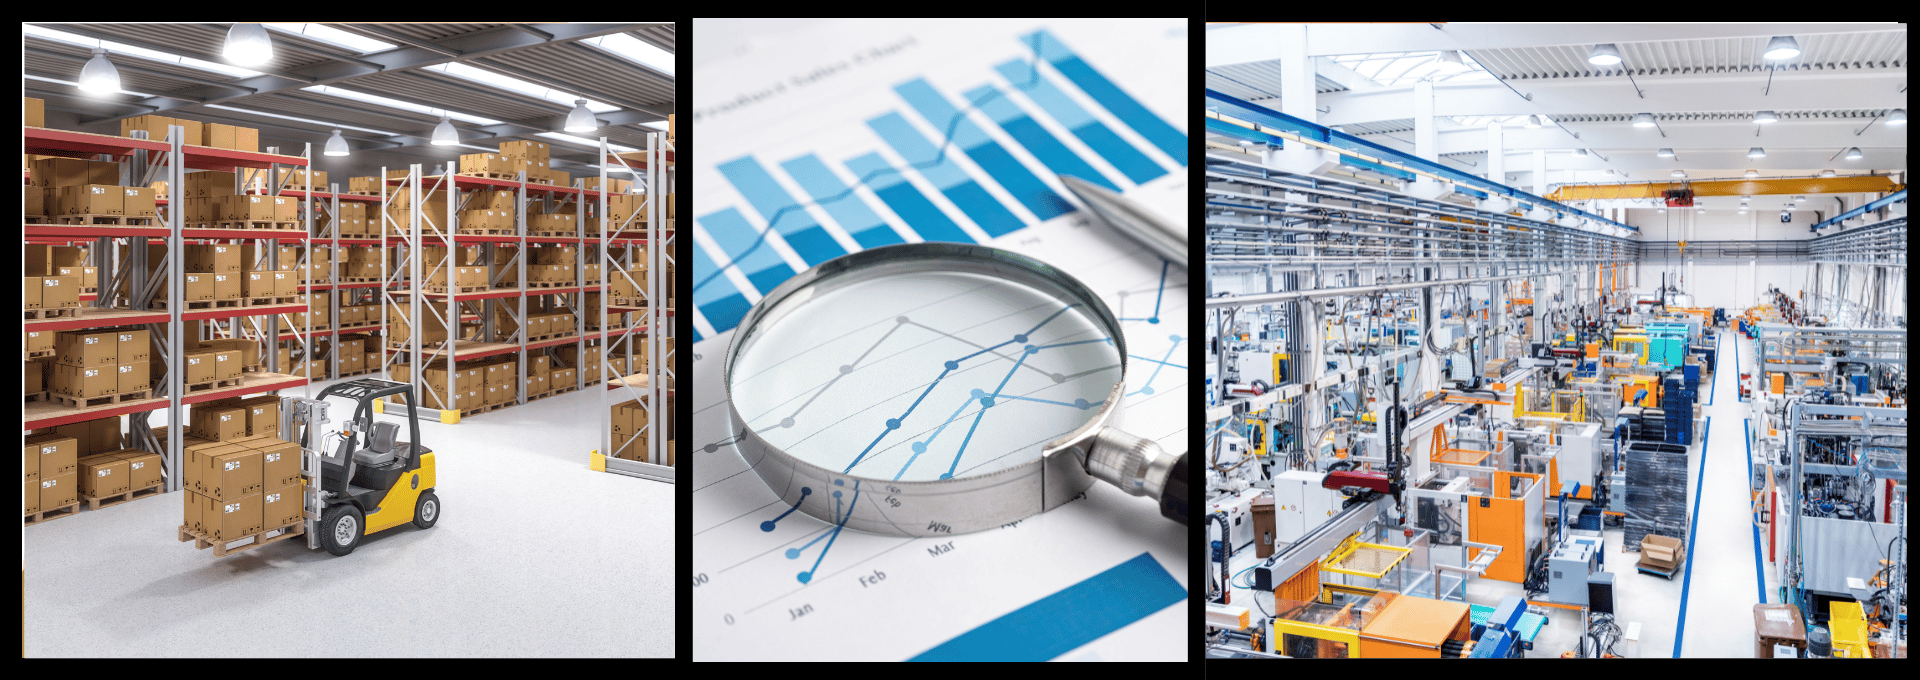
Running an efficient and profitable manufacturing plant relies heavily on the ability to measure performance accurately and consistently. Effective metrics serve as a compass for decision-making, helping managers and employees to identify issues, optimize processes, and drive continuous improvement. They provide visibility into safety, productivity, quality, efficiency, and profitability performance, enabling employees to respond quickly to emerging problems and seize improvement opportunities.
Over my long career in manufacturing, I’ve visited too many plants that operate without posting any metrics for the employees to see. In these operations, performance metrics are discussed only in boardrooms. This practice keeps employees in the dark and removes the data from the point-of-action where it is ultimately most powerful. If you are serious about manufacturing, then shopfloor metrics are central to communication and shop improvement.
Running a plant without posting metrics on the floor for the operators is just a poor way to operate. When only the top leaders see the results, it’s like having a chauffeur driving a limo while an executive sits in the back seat and having the limo’s gages visible in only the back seat. In this situation, the person who has the most control of the vehicle can’t see the GPS, vehicle speed, fuel quantity or any special trouble indicators. It wouldn’t make sense to design a limo this way – right?
Instead of this scenario playing out in our plants, it is better that our executives provide the company vision (aka our target destination) and we, as factory leaders, provide dashboard metrics for our operators. Thus, allowing our operators to drive us to our desired destination, just like a limo driver uses GPS and gages to drive people where they want to go. Metrics do this in factories.
Many years ago, I was promoted to department manager of a packaging operation in a union plant. This department’s efficiency results were awful. So one of the first things I did was to use a spreadsheet to calculate each operator’s daily efficiency. Then, I posted it in the department everyday. After a week, every operator was monitoring their efficiency performance and they all took pride in their own improvement. Productivity improved by 23.5% within a month and these results were sustained over my time there.
Is it possible to have too many metrics?
I once toured a large distribution facility. Before the tour, I had a nice conversation with the distribution center’s manager. We talked about their metrics. He said they tracked 120 metrics. I asked which ones were the critical few. He said, “all of them”. I laughed and quickly realized that he was completely serious. I became intrigued and was curious to see how this approach played out on the floor. What I learned was that having too many metrics was similar to having no metrics. You see, the few critically important metrics get lost in the ocean of many. When I went out of the warehouse floor and talked to operators, it was clear they weren’t connecting to any metrics. They could not tell me what improvement they were most proud of or where they were struggling to meet goal. We talked about an improvement project that they were working on, but they could not tie the project to a result area. These operator conversations explained the disconnect. It was a case of data overload.
Similarly, one of my son’s works for a large sports TV network. We recently had a conversation about one of the sports covered by this network. The network's stats team was tasked with identifying some new metrics for NFL football. My son said that it got ridiculous as too many nonsensical in-game stats started getting aired. The commentators couldn’t even explain the new stats to their audience. It became METRICS OVERLOAD! Too many complicated stats are just as bad as none at all. People get lost in the numbers.
What’s the correct way to manage metrics in a manufacturing plant?
- Always have 1-2 primary metrics in each of these categories: safety, quality, service, productivity and financial performance.
- Tie the metrics to the companies strategic plan. So if the company strategy includes growth, then revenue, customer complaint trends, lead-time and on-time-delivery may be important to track.
- Post the overarching metrics at one main area in the plant or maybe many centralized locations in larger plants.
- Create similar metric categories for department-level metrics and post these within the specific plant departments. This approach provides employees with a look at the plant’s high-level performance (via total plant metrics at the employee entrance) and also connects the plant’s results to their department’s contribution (via the department metrics).
- TV monitors that rotate through slides are fine for overall plant results. However, this is difficult to do at the department level, so usually paper copies are used for the shopfloor display boards.
- Keep the graphs simple. I like to use a simple bar chart by month and a graph line indicating the goal and another line to indicate prior year results.
- Employees should recognize quickly if they achieved a goal or not for the month. I liked to use a green smiley face if we achieved goal, a yellow stoic face if we missed goal but are better than prior year or a red frowny face if we missed goal and prior year. This is just a good way to assess performance at a glance. Traffic light graphics work well for this too.
- Metric drill-downs are a separate thing. If your plant is struggling in a certain area, let’s say maybe a specific quality defect, then a project team should be formed to solve this problem and a metric drill-down will be essential. This could encompass as many as 10 additional more detailed metrics. These metrics can stay within the team, or a separate project metrics display can be created specific to the project.
Follow these guidelines for effective dashboard metrics, and you will see that engagement will drive improvement.
Stay connected with news and updates!
If you want some weekly T4T wisdom coming straight to your inbox for your reading pleasure - look no further! Join our mailing list to receive the latest blogs and updates.
Don't worry, your information will not be shared.
We hate SPAM. We will never sell your information, for any reason.
